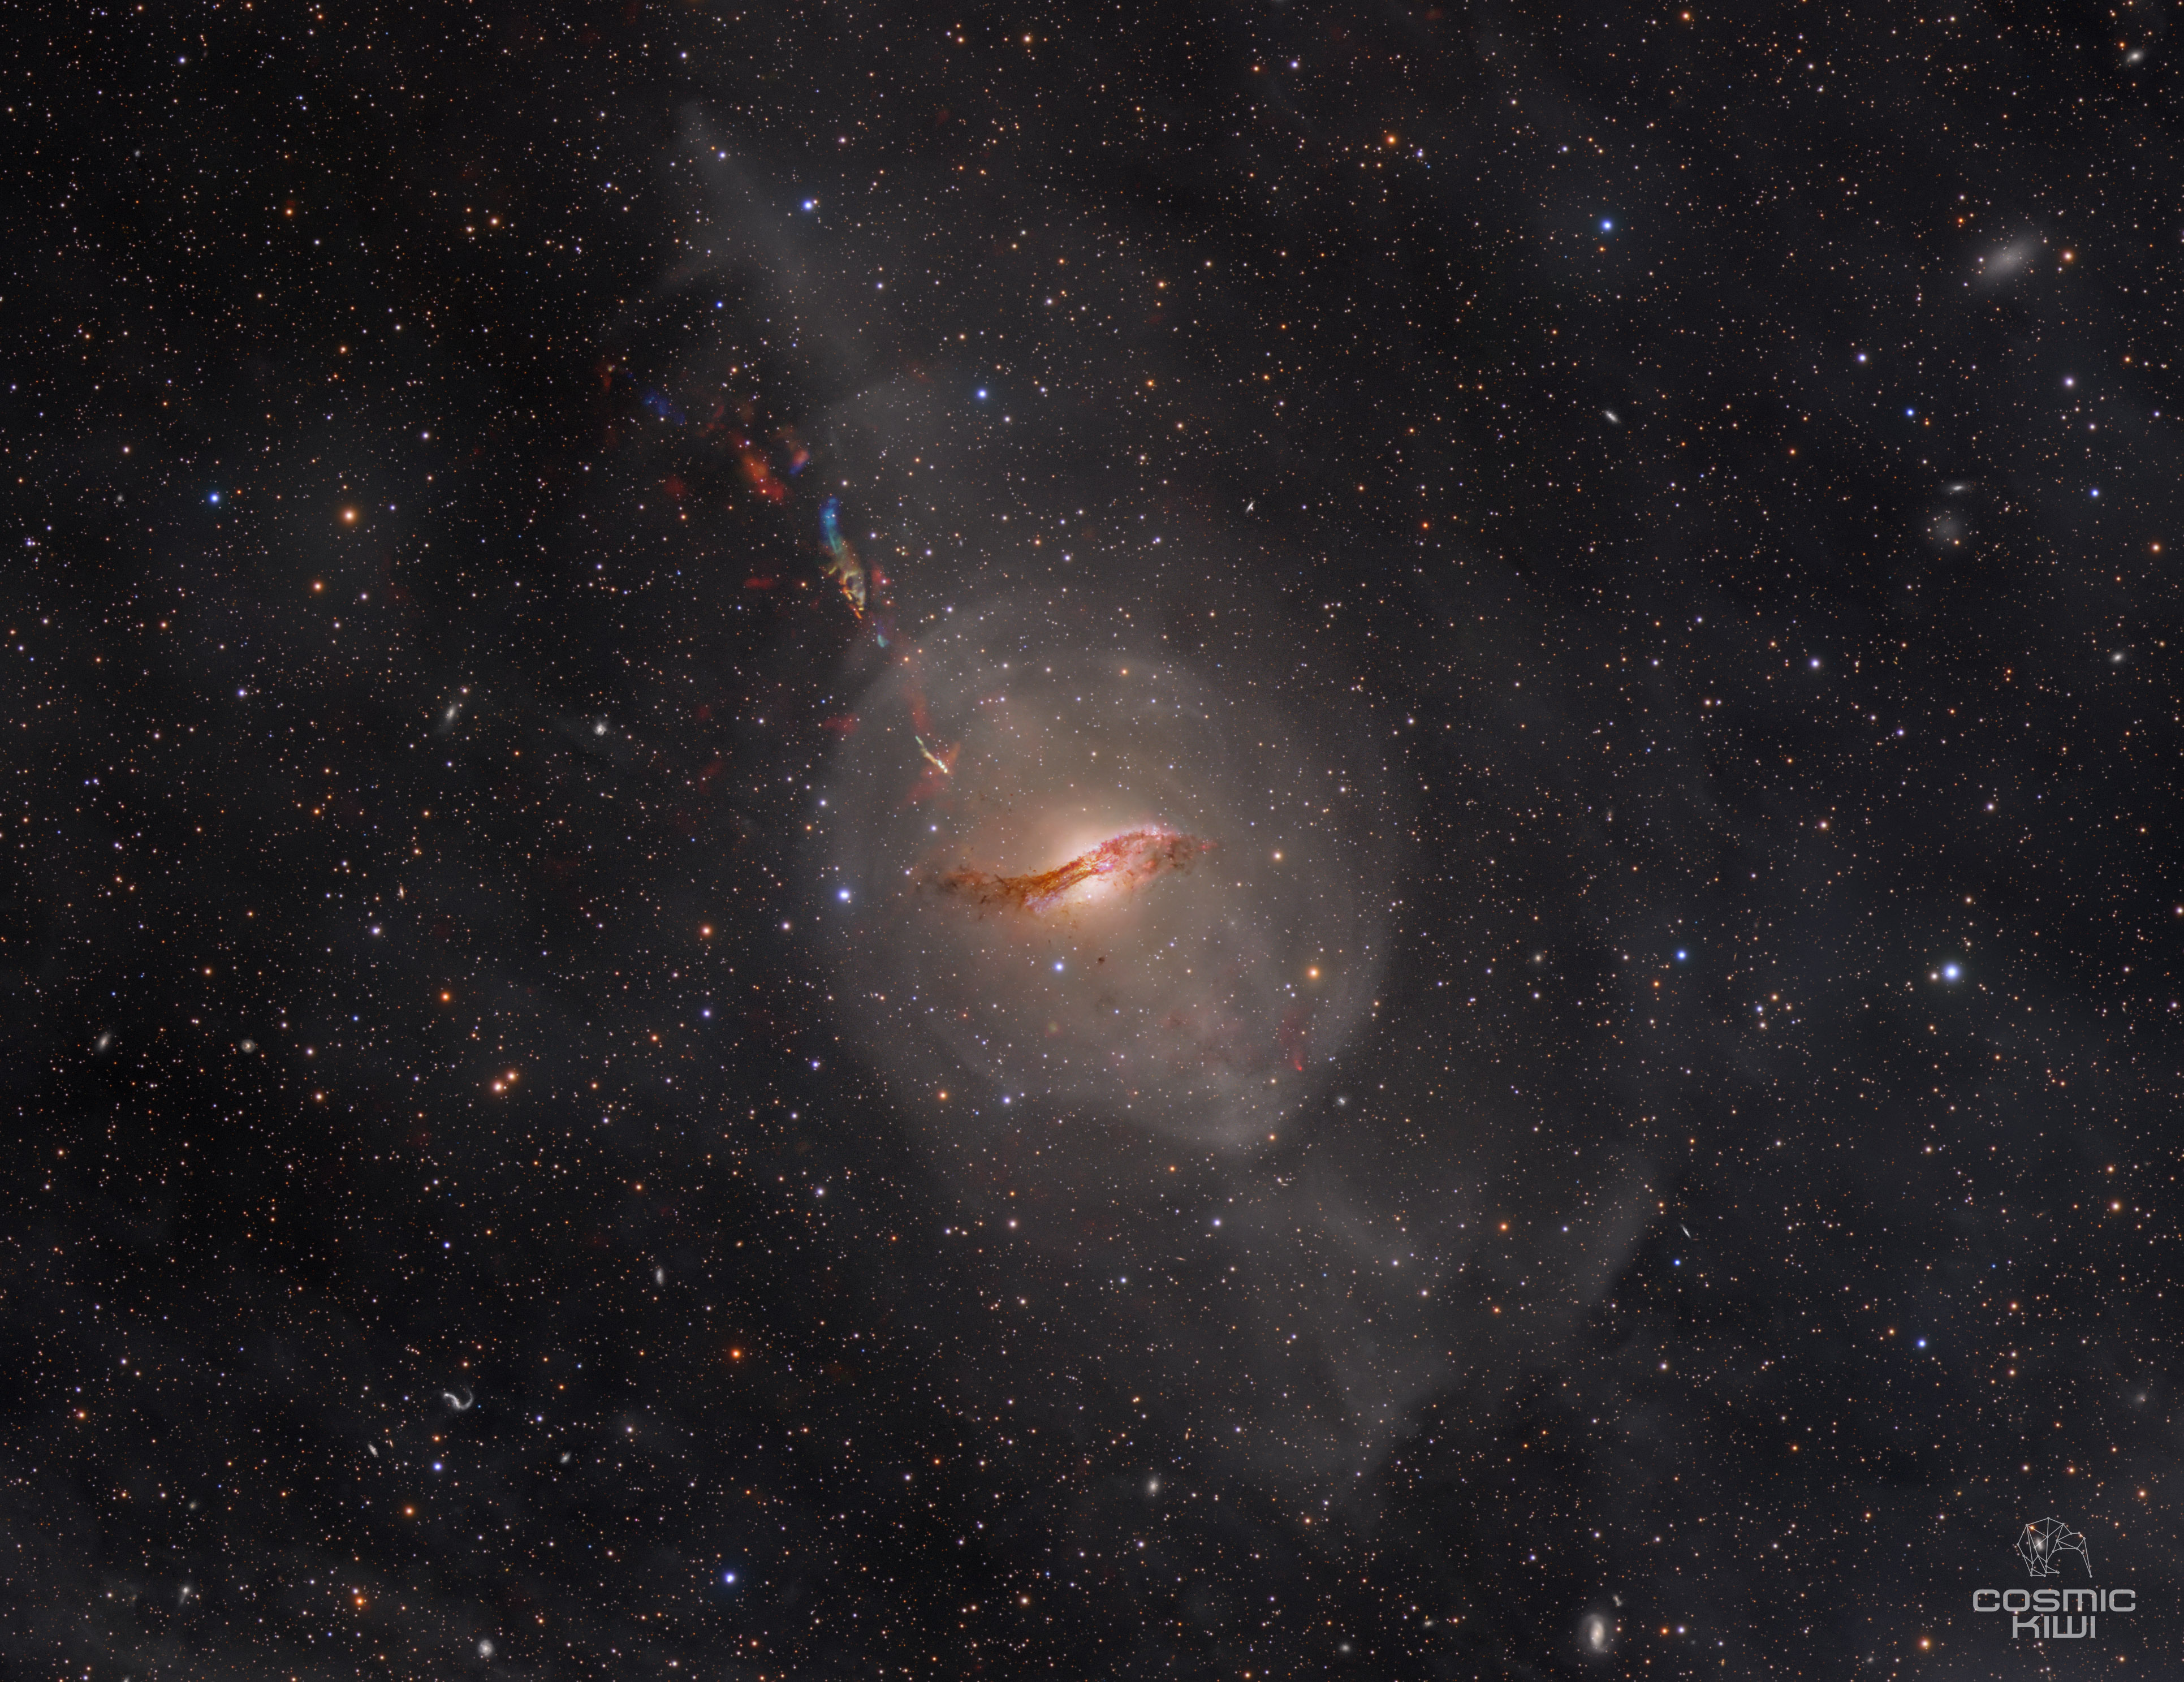
I am very excited to share the first completed image with my new instrument -a red shifted hydrogen alpha and Nitrogen II spectral line mapper (SLM). My SLM was used to capture the Ha radial velocities across the Cen A hydrogen jet and this is presented as a false colour Ha velocity map with +46km/s being blue (as it is blue shifted relative to CenA), +183 - 320 km/s being green and +466 - 594 km/s being red.
Background
This large project started back in 2024 when I started exploring the idea of being able to image red shifted hydrogen alpha features in nearby (low red shift) galaxies. I have closely followed the Dragonfly telescope array project which uses Canon 400mm lenses, with Professor Roberto Abraham at University of Toronto, Professor Pieter van Dokkum at Yale and Deborah Lockhorst at the Herzberg Astronomy & Astrophysics Research Centre. I came across some of their papers describing a new instrument they were developing for Dragonfly, a spectral line mapper and so the idea of possibly creating my own instrument began.
I contacted the Dragonfly team about building my own instrument and they were incredibly supportive. I went ahead and purchased a 155mm diameter, 0.8nm bandpass filter centered at 664.7nm, and got to work with a CNC engineer in Dunedin to manufacture the tilting mechanism.
How does the Spectral Line Mapper Work?
One property of the narrowband interference filters that we all use, is that when light enters the filter at an angle the wavelength passed by the filter shifts to the blue end of the spectrum. This creates a well known issue with fast telescopes of having poor transmission with standard narrowband filters due to their wide steep light cone, which creates a high angle of incidence when the light enters the filter.
The Dragonfly team had the idea to turn this bug of interference filters into a feature. Firstly, they decided to place the narrowband filter in front of the lens where the light entering the filter is non-converging rather than having it behind the lens within the steep light cone. This allows an extremely narrow bandpass to be employed without any significant reduction in transmission. They then decided to purposely tilt the filter to blue shift the central wavelengh passed by the filter. My filter is centered at 664.7nm when at 0 degrees tilt, but as it is tilted the central wavelength shifts to the blue, until at a tilt of 18.3 degrees it passes 656.3nm. The tilt is controlled by a servo motor with a high resolution encoder, and requires very careful calibration which is a story in its own right.
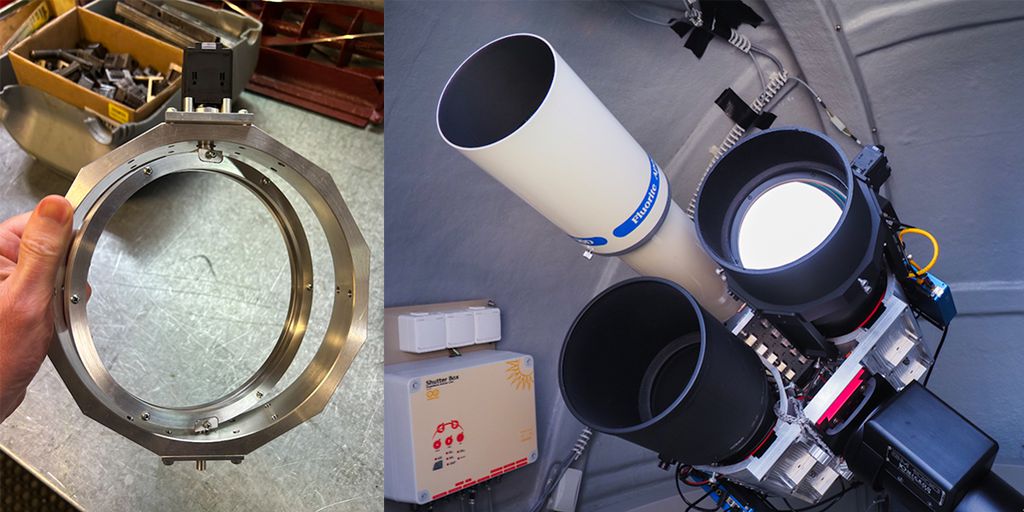
The filter tilting system (left) and the spectral line mapper installed on the bottom right lens (right)
Why build a Spectral Line Mapper?
Numerous galaxies that are close to us with a low redshift (low radial velocity) have interesting hydrogen alpha features. However, as galaxies become more redshifted with a higher radial velocity, the red shift results in hydrogen alpha moving outside the bandpass of our 656.3nm narrowband filters. The spectral line mapper allows you to dial in the central wavelength to the exact redshifted Ha to be imaged.
The spectral line mapper also uses an incredibly narrow 0.8nm fillter which allows the line mapper to be used as a type of integral field unit, where a series of images of the same field taken at different tilts/wavelengths can be used to create a data cube of not just the spatial x, y information but also the wavelength and thus the velocity of the hydrogen alpha at that location. This can reveal more information about the physical processes occurring, such as whether gas is inflowing or outflowing. In addition, as the narrow band pass allows NII to be isolated and imaged, you can create Ha:NII ratios which can give information about the source of ionisation.
Centaurus A and its jet
Active galactic nuclei (AGN) can influence the evolution of their host galaxy, and are the subject of intense study. Inflows of gas and matter into the galaxy/AGN feed the supermassive black hole, allow the galaxy to gain mass and powers star formation. Outflows from the AGN, through mechanisms such as radiative winds or plasma jets, results in the loss of matter so that galaxies do not continuely grow and this outflow distributes matter and energy into the interstellar medium.
Cen A is a relatively low power radio galaxy and is the nearest AGN to the Milky Way. It has a well known radio jet and filaments of ionised hydrogen alpha, which creates an opportunity to better understand the physics of AGN outflows and Jet-ISM interactions. At Cen A’s systemic velocity, Ha is red shifted to a wavelength of ~657.5nm, which usually within the bandpass of most amateur narrowband Ha filters.
The Cen A Ha jet comprises of an inner and outer filament. The outer filament is quite interesting as in this region the plasma jet is low brightness and poorly collimated, and it is unclear whether the Ha jet is a relic of past activity or is an active structure. To gain more information of the physical processes of the jet it would be useful to know the velocity of the Ha as well as its morphology. This outer filament has been studied with the MUSE integral field unit on the Very Large Telescope at ESO. MUSE creates a 2D image but every pixel (a spaxel) captures a full spectrum rather than just one wavelength. MUSE found that the the outer filament contains various components with some areas being blue shifted relative to CenA’s velocity, suggesting that gas clouds are being directly interacted with and accelerated towards us by the plasma jet (Santoro et al, A&A 575, L4 (2015) DOI: 10.1051/0004-6361/201425511 ).
Ha Velocity Map
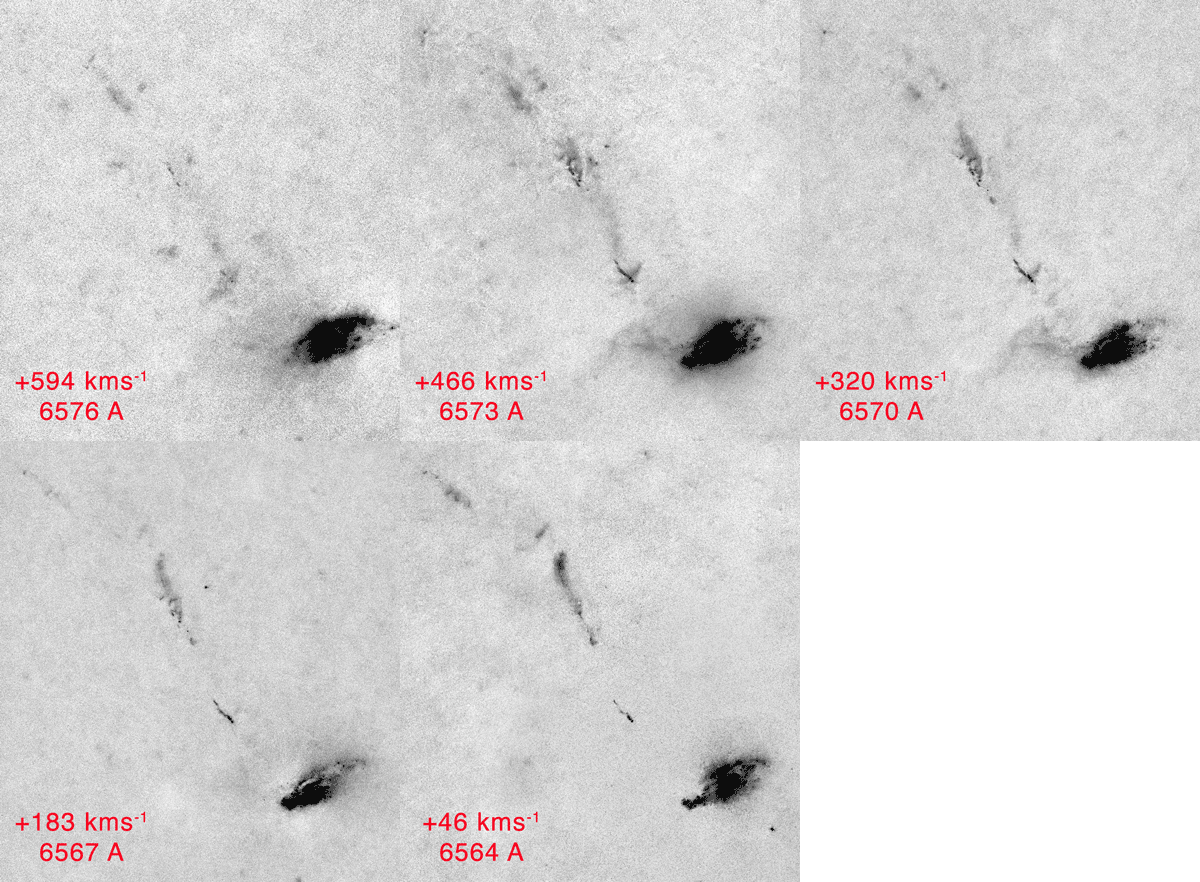
For this image, I captured Ha at various tilts/wavelengths and thus velocities. These were 656.4nm = +46 km/s, 656.7nm = +183 km/s, 657.0nm = +320km/s, 657.3nm = +466km/s and 657.6nm = +594 km/s. For reference the Milky Way is 0 km/s and Cen A is ~540km/s. As the jet is moving towards us, the fastest moving jet elements are blue shifted relative to Cen A, and therefore appear to be lower velocity relative to the Milky Way. These have been colour mapped on the final image with +46km/s being blue (as it is blue shifted relative to CenA), +183 - 320 km/s being green and +466 - 594 km/s being red.
The velocity map reveals that there are a range of velocities throughout the Ha jet. There are areas of Ha at the higher velocities (red), these represent Ha clouds near the velocity of CenA itself and may be part of the circumgalactic medium of Cen A that are inflowing and just beginning to interact with the plasma jet. The gas clouds then accelerate in an outflowing direction to faster velocities relative to CenA and become increasingly blue shifted to CenA. At the mid-velocities (green/orange) there are numerous linear components which appear to be gas clouds that are directly being compressed and expanded by the plasma jet. The low velocity components (blue -while it is low velocity relative to the Milky Way it is actually the fastest moving gas relative to Cen A) largely flow outwards from these mid-velocity areas.
The velocity map also reveals that there are three distinct low velocity areas where the plasma jet is interacting with gas clouds and is actually accelerating them to the highest velocity relative to CenA (blue in the image)-the inner jet, the outer jet and a more distant jet. This distant area of interaction from red high velocity Ha to blue low-velocity Ha is ~30 kpc from the galaxy core, and may indicate that even at this distance the plasma jet is still able to drive these outflows.
There are a number of other interesting features, with filaments outflowing from the central galaxy core to the East (+320 - 466 km/s), and the Southern Jet is visible at the longer wavelengths. Given the Northern Jet is blue shifted as it is moving towards us, the Southern Jet is more red-shifted and I plan on imaging this at even longer wavelengthes next season to see if there is more to detect. There is also an interesting globular Ha cloud to the East of the Southern Jet which also contains a mid velocity component, which may be a small satellite dwarf galaxy.
Comparison with MUSE
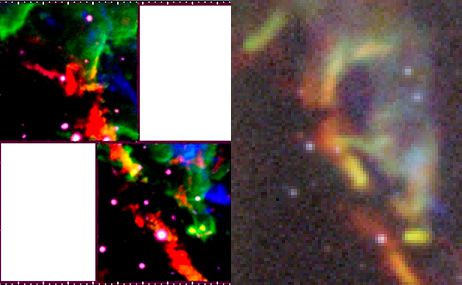
I compared my data to that of MUSE to assess its accuracy. As you can see below, while I have much lower resolution, my velocity map is consistent with MUSE’s results supporting the validity of the wider field velocity map.
A very special thanks to Professor Roberto Abraham, Professor Pieter van Dokkum and Deborah Lockhorst whose help has been just fantastic. The Dragonfly team is the process of finishing the mind blowing MOTHRA scope in Chile which contains an incredible 1140 telephoto lens equiped with spectral line mappers. This will act as a 4.8 metre diameter apeture refractor with a f ratio of 0.08, and aims to directly image the cosmic web.
A big thanks to my son Adam, who has helped with the construction and commisioning of the line mapper, including making sure I did not drop the filter when assembling it in its housing. He is also much better at calculus than I am, and helped with the function to calculate the tilts required and wrote the python scripts to control the tilt servo motor/encoder.
Technical Details
Nikkor AF-S 400mm f/2.8E FL ED VR
Takahashi FC-100DZ
DIY Spectral Line Mapper with Iridian Spectral Technologies 664.7nm filter
Imaging Cameras: ToupTek ATR585M and ZWO ASI6200MM Pro
Mounts: 10Micron GM1000 HPS
Filters: Chroma Blue 50 mm· Chroma Green 50 mm· Chroma Lum 50 mm· Chroma Red 50 mm
Accessories: ScopeDome 2M Dome
Exposure
Spectral Line Mapper 322×600″(53h 40′)
Chroma Blue 50 mm: 183×300″(15h 15′)
Chroma Green 50 mm: 159×300″(13h 15′)
Chroma Lum 50 mm: 100×300″(8h 20′)
Chroma Red 50 mm: 275×300″(22h 55′)
Total Integration:113h 25′
Location
Dunedin, New Zealand
Follow me on Astrobin to stay up to date with my latest images.